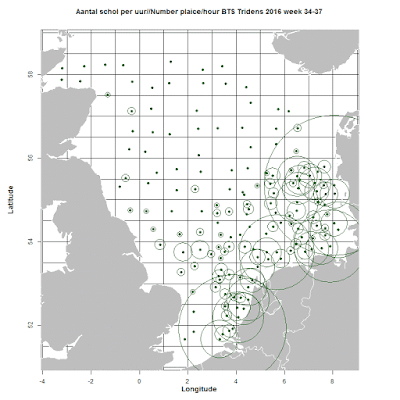
Aangezien beide schepen de boomkorsurvey hebben afgerond is het mogelijk om een eerste overzicht te geven van de scholverdeling tijdens de survey. In figuur 1 staat het aantal gevangen schollen per station. Grotere cirkels staan voor meer schol. Het is duidelijk dat verder van de kust minder schollen per trek gevangen worden.
As both ships have finished their respective beam trawl survey, it's possible to give a quick overview of the plaice distribution. Although not in exact numbers, figure 1 shows the density of plaice at the stations (larger circles=more specimens). It is clear that further offshore the numbers of plaice in the catch are lower than nearshore.
 |
| Figuur 1 // Figure 1 |
The smallest plaice measured was 10 cm, the largest 56. The mean length was 26 cm. Below, the average length of plaice at each station (larger circles=larger fish). Figure 2 shows that the larger plaice lives further offshore than the smaller plaice.
 |
| Figuur 2 // Figure 2 |
Although not all plaice has been weighed individually, length-frequency distributions can be transposed into weigth by using a standard length-weight relationship. Figure 3 shows the total weight of plaice per hour per station.
 |
| Figuur 3 // Figure 3 |
No comments:
Post a Comment